Friday, February 25, 2011
Wednesday, February 23, 2011
Tuesday, February 22, 2011


Monday, February 21, 2011
S&P 500 Technical Chart Analysis: Powerful Wave 3 Bull Market Rally Not Over Yet
Excerpt from the most recent BullBear Market Report for BullBear Traders members:
SPX Chart Analysis
The very long term monthly exponential moving averages will be in full bull market alignment as soon as the 20 moves above the 50, which appears to be imminent.

�
The weekly chart has already moved into full bull market alignment with a bull cross of the 50 over the 200 a month ago.
�

�
The daily chart shows a probable Wave 3 rally off the July 2010 bottom.
�

�
Evidence strongly points to this move as a Wave 3 impulsive bull move and not a C wave corrective. Within that context there are a variety of scenarios describing where the index is within that Wave 3. Above is one possible scenario, which calls for a minor (iii) top soon near 1340. The wave (iv) correction would be of the same degree as the August 2010 decline, which would suggest a selloff lasting 2-4 weeks and giving back 38.2%-50% of the prior wave from the September 1, 2010 bottom.
Here's a short term chart showing the most recent wave following the November 2010 correction.
�

�
Wave ii was essentially a zigzag (more noticeably a zigzag in other indices) and the proposed wave iv is a clear flat, so there would be alternation. But the November decline lasted a month and the late January correction took less than two weeks.
The SPX futures chart shows that the proposed wave iv tagged the lower rail of the uptrend, which gives more credence to this count:
�

�
We can also see that three Fibonacci extension targets converge in this area, suggesting that some kind of top could occur there.
A somewhat more bullish scenario calls for a correction of a lesser degree in the 1340 area followed by a rally to a cluster of Fibonacci targets in the 1500 zone for a Wave 3 top. The penetration and weekly close above the rising blue trendline suggests this scenario may have some validity. ��After consideration of all currently available data I am tending to lean towards this scenario.

�
Another possibility is a move within the short term trend channel (black) to the 1375 area where another cluster of Fibonacci targets is situated. It's also the site of the 78.6% Fib retracement of the entire decline from the 2007 high.
�

�
There are quite a few other plausible bullish wave counts and scenarios but these seem to be the most likely at this time. I am most concerned with identifying the wave count that calls for a wave 3 top that would be the companion to the August 2010 wave 1 top. A decline of that degree might be worth taking some profit and buying back after the decline. Any pullback of a lesser degree would not be worth the risk of losing our position. Keeping in mind that this is a Major Wave 3, we want to be very careful to not be shaken out of our position because buy points have been and will continue to be scarce throughout this wave.
The bearish count could see a C wave top at any time. Any break of the uptrend off the September bottom would put this scenario in play.
�

�
The 161.8% Fib extension of the proposed A wave comes in just a few points shy of the 2007 high, so its conceivable that Wave 2 could retrace nearly 100% of Wave 1 before failing in a Wave 3 bear market.
�
�
READ THE FULL 8 PAGE REPORT, ANALYSIS AND COMMENTARY HERE:
�
http://www.thebullbear.com/group/bullbeartradingservice/forum/topic...
�
The report is accessible to members of the BullBear Traders room.
For more information:�About BullBear Traders
�
�
Need some help staying on the right side of the markets? �Join the�BullBear Trading�room at�TheBullBear.com. �You'll get this kind of timely, incisive, unbiased�stock and financial market trading and investment technical analysis�daily. �It's free to join, no credit card is required and if you like my work you just make a donation at the end of each month.
�

Introduction to 02/15/11 BullBear Market Report
Here's the introduction to the latest BullBear Weekend Report:
Introduction
US equity markets have continued to make higher weekly closing highs, climbing relentlessly in defiance of calls for a pullback or a resumption of the bear market. Treasuries broke down from a month long consolidation and resumed their downtrend as capital continued to exit the perceived safety of fixed income for risk assets. Gold appears to have completed a correction of its recent decline and may be set to join Treasuries in a downtrend as investors exit safe haven plays. The Japanese Yen may have finally made a significant, long term top (and a bottom for Dollar.Yen) and if it breaks out soon it may signify a resumption of the carry trade, which would mean that another major liquidity stream is coming online to power the stock market rally even higher. The US Dollar Index may have found a bottom and there is some potential that it may climb together with US stocks as investment demand for big cap, developed nation companies appears to be the emerging story. There are some technical considerations which suggest a minor top may be due sometime soon. The worst case of the likely scenarios is a correction akin to the August 2010 decline. The likelihood of a top to this run resulting in a resumption of the bear market is low, but as always we must keep our minds open to the possibilities and keep one eye on the mouth of the bear cave.
Certain world markets--largely in Asia--have been in a downtrend since November and others, such as Korea's KOSPI, have experienced strong selling very recently. This has placed many traders and analysts on alert for a big decline. Indeed it is worth keeping a sharp lookout to determine whether these divergent markets are leading a topping process. A dramatic divergence between US and other developed market equities (Europe and Japan) and much of the Emerging Markets and BRIC markets has developed since the November bottom. At this moment I actually regard this as a bullish development.
First, from a sentiment perspective, the outflow from these select emerging markets has been developing since November and only now has it garnered recognition in the investment and analysis community. That in itself may be a sign that a bottom is near. Also, that investors are apparently taking profits from their emerging markets trades and moving capital into developed markets is a sign that investor confidence has returned. The considerable differentiation among world markets may be a sign that the phenomenon of a universally rising liquidity pool driving all prices higher may be in the process of being replaced by more long term allocations of capital based on real investment decision making. While that may not reflect the common wisdom at this time, markets are generally forward looking and likely reflect a range of factors that are as yet generally unknown.
Second, there are some technical signs that the markets in question have completed a three wave corrective pattern and are now ready to bottom and rally. Friday saw some strong buying and at the time of this writing Asian markets are generally up 1.5-2.5% with India's NIFTY leading the way. Investors and traders may want to give the emerging markets and BRIC segments some consideration as a long entry opportunity at this time.
In spite of the ongoing rally, the general sentiment backdrop continues to be significantly pessimistic. A review of any popular investment analysis blog site shows a continued prevalence of negatively biased themes both in the editorial content and in the reader commentary. Even now as I write this CNBC Asia is featuring an analyst who is calling for a major currency and sovereign debt crisis, calling it "Financial Crisis II". These kinds of views are still common and even prevalent. My point is not that there couldn't be such a crisis, but rather that the broad public and even many informed investors continue to fear the markets and disbelieve the rally. The sentiment environment conducive to a long term top does not yet appear to exist.
I'm keeping an eye on recent moves higher in�LIBOR,�LIBOR-OIS spread (LOIS)�and�Treasury-EuroDollar (TED)�spreads. If there is to be a renewed credit crisis it should show up in interbank credit spreads. Barring a major, sudden disruption of credit and liquidity, I generally expect the uptrend in US stocks to continue, with the potential for lesser degree corrections from time to time. Longer term projections indicate a top on the order of the April 2010 peak coming in the vicinity of the 2007 highs or near a 100% retracement of the prior bear market.
The greater threat to our trade at this time is not the risk of a major (April 2010 level) correction but that we exit our position too soon. The best thesis continues to be that we are in a Major Wave 3 advance within the context of a bull market.
�
�
READ THE FULL 8 PAGE REPORT, ANALYSIS AND COMMENTARY HERE:
�
http://www.thebullbear.com/group/bullbeartradingservice/forum/topics/021311-bullbear-market-report
�
The report is accessible to members of the BullBear Traders room. �For more information:�About BBT
�
�
Need some help staying on the right side of the markets? �Join the�BullBear Trading�room at�TheBullBear.com. �You'll get this kind of timely, incisive, unbiased�stock and financial market trading and investment technical analysis�daily. �It's free to join, no credit card is required and if you like my work you just make a donation at the end of each month.
�
THE EWI ARGUMENT: A Critical Analysis of Robert Prechter and Elliott Wave International (March 2009-Present) Part 2
A Critical Analysis of Robert Prechter and Elliott Wave International
(March 2009-Present)
�
�
In the first installment of this series, I examined Robert Prechter and Elliott Wave International's current wave analysis and proposed some alternate views. �In this segment I will examine EWI's market timing record. �First, I'll run down the history of EWI's market calls from March 2009 to present. �In conclusion, I will analyze a few of the flaws in trading methodology which led to the failed trading results documented here. �In subsequent installments of this review I'll analyze larger issues of data and epistemological methodology that underly EWI's conclusions of a deflationary depression.
The source material for this study is the�Elliott Wave Theorist�(EWT) and�Elliott Wave Financial Forecast�(EWFF) as well as numerous writings and audio and video interviews with�Robert Prechter�and�Steve Hochberg. �For the sake of simplicity this body of work will be referred to as "EWI". �Bold emphasis in quoted text is mine to illustrate key points. �All EWI images are drawn from freely available material published online and are linked to their sources.
To get the most out of this piece it's best to have a basic understanding of Elliott Wave theory. �I selected this tutorial at random from among the many available on the web:�http://www.tradingfives.com/articles/elliott-wave-theory-basics.htm.
�
II. �Market Timing
�
SUMMARY
For reasons of time and space and access to insufficient data I'll have to limit the parameters of this discussion to the period of March 2009 to the present. �It's clear that�EWI did call a bottom in the US stock markets�in late February of 2009 and recommended to subscribers that they cover short positions at that time. �Since then Robert Prechter has recommended that subscribers enter 200% fully leveraged short positions on at least three occasions. �There is no evidence that EWI has ever called for those short trading positions to be covered and they are assumed to be still open at a substantial net loss. �Elliott Wave Financial Forecast has maintained a Primary and Intermediate degree short position going back to at least September 2010 but evidence suggests that that position goes back considerably further, perhaps all the way back to September 2009. �Some of the problems of trading methodology leading to the failed results documented here are: a lack of trading discipline, particularly no use of stop losses; a consistent practice of "top picking"; a tendency to regard market analysis as an intellectual exercise rather than a profit making endeavour.
�
ANALYSIS
Bob Prechter and EWI have been calling the top of the presumed corrective wave from the March 2009 low since August of 2009. �In July 2009 they began to anticipate the end of the now 23 month long rally after just 4 months:
On February 23, EWT called for the S&P to bottom in the 600s and then begin a sharp rally, the biggest since the 2007 high. The S&P bottomed at 667 on March 6. Then the stock market and�commodities went almost straight up for three months as the dollar fell….The June�11 issue called for interim tops in stocks, metals and oil and a temporary�bottom in the dollar. The Dow topped that day and fell nearly 800 points; silver reversed and fell from $16 to $12.45; gold slid about $90; and oil, which had just�doubled, reversed and fell from $73.38 to $58.32. The dollar simultaneously�rallied and traced out a triangle for wave 4. Bonds bounced as well….Corrective�patterns can be complex, so we should hesitate to be too specific about the�shape this bear market rally will take. But from lows on July 8 (intraday) and�10 (close), the stock market may have begun the second phase of advance that�will fulfill our ideal scenario for a three-wave (up-down-up) rally. �(07/09 EWT;�The Bounce Is Aging, But The Depression Is Young)
Now in his August 2009 Theorist, Bob explains what "the prudent thing to do" in the markets is, based on the same Elliott wave pattern and sentiment indicators -- plus the Dow's 3/8 Fibonacci retracement from�the March 9 low...Bob Prechter's August Elliott Wave Theorist published a week and a�half early: he did so to give subscribers time to prepare for what's�ahead. The issue provides a list of levels that mark Fibonacci and�Elliott-wave related retracements for the rally. He analyzes which one�is the most likely end point, and even explains how you can make the�most of the waning rally.�Prechter Stands Alone Again... He's Done the Math
The Dow has just entered the lower end of its upside target range we cited back in April; the S&P is close behind. Restored optimism for a lengthy recovery at worst � a new bull market at best � is one of several signs of an important peak. All the same markets that recovered together have now set the stage to decline together. And this time there will be no mistake about the next wave down. It will be a "third of a third," also known as the point of recognition. (08/09 EWFF; 'Worst Is Over' Optimism Sets Up Volatile Third Wave Surprise)
The stock market has been in an upward correction for over two months. Evidence is quite strong that the rally is over. �(08/09 EWFF)
�
WATCH VIDEO:�Bob Prechter on CNBC August 17, 2009�calling an end to the rally.?
�
Here's what the market looked like at that time, with the EWI wave count.

So by mid-August of 2009, EWI called a Wave 2 top following a 38.2% Fibonacci retracement of the decline from the October 2007 high. �The market immediately turned higher.
�
In September 2009, the warning flag of an imminent Wave 3 decline was still out in spite of yet higher highs:�
How A Bear Can Be Bullish And Still Be Right: "April 2009 Elliott Wave Financial Forecast calculated a specific target range for the Dow's rally: the 9,000-10,000 level."
�
In October 2009, EWI sensationally compared the market at that time to the Dow in 1929:�Black Monday: Ancient History Or Imminent Future?. �Once again, a top was called.
Yet the extremes in optimism � as measured by unanimously bullish investor surveys and exuberant sentiment readings � point to a dying rally. Momentum and breadth readings support that case, as do telling Elliott wave patterns. �From a socionomic standpoint, investor mood has returned to levels of enthusiasm we saw at the high � just as Elliott-minded investors would expect from a wave 2 rally. �Once again, EWI analysts are virtually alone in their deflationary forecasts. This issue demonstrates why the mainstream conventional wisdom � just as it did at the top in October 2007 and the bottom in March 2009 � will again miss a major reversal on the horizon. �(10/09 EWFF,�What to Read When 'Everyone' is Bullish)
[The week of Oct. 12, 2009], the Dow touched 10,000 and the S&P hit 1095, reaching the upper end of our range for a normal rally and fulfilling our original expectations from last March-April. (10/09 EWT;�How to Prepare Yourself for the 'Serious Event' Ahead)
For the second time, EWI called a Wave 2 top, this time specifying that the outer limits of its projected range had been met. �Later, this "upper end of the range" would magically move much higher with the market. �Here's what the S&P 500 looked like at that time, as EWI moved the C wave higher with the market (red arrows indicate prior top calls):

This chart from the October 2009 Elliott Wave Theorist attempts to illustrate a rally that is topping due to declining momentum:
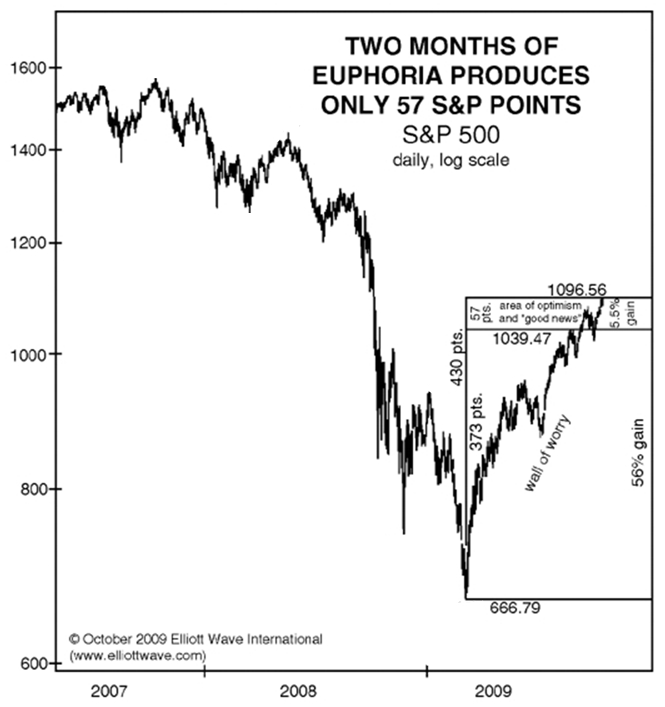
This S&P 500 Chart Tells the Two-Part Truth:�
You see when most of the rally unfolded. Six months of serious worry produces a 373-point climb, whereas "two months of euphoria produces only 57 S&P points." �Now, the two-part truth about this rally is an easy story to tell. It's literally a few lines and notations on a price chart. Yet have you seen or read ANYTHING like this in the past two weeks? Has anyone else pointed out that over the past two months, the stock market "rally" has in fact slowed to a crawl?
It's unclear whether the question is rhetorical, since similar bearish pronouncements were indeed widespread and prevalent at the time. �Capitalizing on the overwhelmingly bearish sentiment among traders and investors, readers were invited to access the October 2009 EWT and EWFF for free:�
Eight months ago, the stock market began a very large rally -- the gains exceeded 60% in the S&P 500. Everyone knows this. But here's a fact that has gone virtually unreported: The vast majority of those gains (about 90%) were from March through August. By comparison, September and October were sluggish.
Yet the past two months have been the very time when the financial press has been the loudest about "green shoots," "recovery" and "new bull market." So the question is WHY -- why so much enthusiasm, even as the evidence literally fades away?
No one asks questions like this, never mind provides the answers. The one exception is Bob Prechter. And if most investors suddenly DID learn the details of his answer... well, the information would buckle their knees.
Prechter does of course provide a detailed answer in his�current Elliott Wave Theorist. The latest Elliott Wave Financial Forecast expands on that answer. You can read both award-winning monthly market letters right now for free!
But let me be clear: The answer is in fact a forecast. What Prechter says is bigger and more important than these two publications. It could prove to be the most important forecast he has offered since the financial debacle began. (Robert Prechter Latest Financial Market Analysis)
In early November of 2009, while simultaneously citing "declining volume during the rally" as a signal of a top, EWI also cited "record high dollar trading volume" as evidence of excessive bullishness:
We do know one thing: When everyone is thinking the same, the opposite will happen.
Right now, record high dollar volume of trading shows that confidence, at least on this basis, has reached a new historic extreme. (11/09 EWFF)
EWI apparently attempted to pick a top in early November in a short term update:
EWI Chief Market Analyst Steve Hochberg wrote in his Wednesday Short Term Update, "(On Tuesday), the VIX closed back within two standard deviations of its 20-period moving average, which for the past seven months, has resulted in a near-term rally."
On Wednesday, stocks closed up;
Thursday�saw a huge rally.
On Friday morning, the Dow regained the 10,000 level. But the Update reports that the "next leg (down) … is fast approaching." (Robert Prechters Stocks Latest Bear Market Update)?
Also in November 2009, EWI insisted that momentum was waning and that a top was around the corner:
We're now in mid-November; the move up from March became the biggest rally in more than five years. Yet the facts are these: Gold is the only commodity to reach an all-time high, the Dow Industrials the only stock index to see a new closing high on the year. �A seasoned technical analyst knows this is a classic "non-confirmation" -- and Bob Prechter is a lot more than just seasoned. Here's what he says in his brand-new November 2009 Elliott Wave Theorist: "Only the bluest of the blue chip markets in both the stock and the commodity sectors � i.e. the DJIA and gold � made significant new highs, while their lesser counterparts have so far all failed to confirm. This type of divergence in trends is the most traditional of all technical conditions warning of distribution." �The "experts" apparently think that a few months of financial chaos in late 2008-early 2009 was as bad as it's going to get. They'd have you believe (hope?) that those few months is all it took to reverse a mania that was decades in the making. �But our technical indicators aren't based on hope. They give us the facts and the evidence. That's why we ignored the experts in July 2007 and February 2009, and why we ignore them now. Don't allow the recovery hype to put your portfolio at risk. You can read a market forecast that truly is independent. �How to Identify the Continuing and Looming Deflationary Forces...the just-published November 2009 Elliott Wave Financial Forecast sums up what Elliott investors expect next: "This trend reversal also provides an early warning signal that the economic rebound that so many are hailing is near an end." �Has the Optimistic Bias of the Past Decade Finally 'Hit the Wall'?�
�
In late November of 2009, Bob Prechter appeared on CNBC to call the top yet again. �It's interesting that the "Fast Money" crew largely agrees with his prediction that "we are in for a very large decline in 2010...at least as big as what we saw in '08", which contrasts sharply with his characterization of sentiment as excessively bullish at the time.
�
WATCH VIDEO:�http://www.youtube.com/watch?v=Tz5PrY2gjz0
�
Prechter then proceeded to recommend a 200% fully leveraged short position to subscribers:�
http://www.marketwatch.com/story/elliott-wave-adviser-now-aggressively-bearish-2009-11-25
http://yelnick.typepad.com/yelnick/2009/11/prechter-goes-all-in-short.html
�
Here's what the market looked like at the time:

December of 2009 was the first month since August that EWI did not attempt to pick a top in the market. �It instead focused on fundamentalist arguments for a pessimistic view of future market activity:�What the Government Doesn't Want You to Know and How it Can Hurt You in 2010
�
In spite of a continued rally, in late December EWI predicted that 2010 would bring a major decline:
Back in the late 1990s, when the "unstoppable" NASDAQ began to experience regular days of double-digit drops, it was "Buy-the-Dip." Now, it's "buy the entire lost decade." And, as the Dec.31, 2009 Elliott Wave Financial Forecast Short Term Update reveals -- current sentiment readings "continue to show that stock market bears have packed up and moved to Florida for the winter."
The Dec. 31 Short Term Update also reveals two mind-blowing charts of the S&P 500 versus Investor Intelligence Advisors Survey Percentage of Bears -- AND, the S&P 500 versus the percentage of "Fully Committed" bullish advisors since 2000. The current reading is the lowest bearish percentage in 22 years.
Take one look at the evidence, and you'll see that a defining pattern emerges: Low levels of bearishness have consistently coincided with one kind of market move. Combine this picture with the other measures of investor sentiment like momentum, volume and Elliott wave structure, and the evidence tilts overwhelmingly in favor of an unforgettable year. �(New Year New Economic Boom? Why 2010 Should Be One to Remember)
Here's how the chart looked at the end of 2009:

The market finished the year above all three of Prechter's top calls.
�
In mid-January, once again, Prechter recommended a 200% fully leveraged short position:�http://yelnick.typepad.com/yelnick/2010/01/prechter-recommends-200-short-again.html
�
In late January, EWI cited "cash on the sidelines" as an reason for picking a top in the market:
Myth -- Cash on the sidelines is bullish for stocks:�This refrain rang like a gong all the way through the declines of 2000-2002 and 2007-2009. In February 2000, when mutual fund cash hit 4.2% (compared to 3.8% in November), The Elliott Wave Financial Forecast issued its "cash is king" advice. Once again, the word on the street is that there is way too much "cash on the sidelines" for stocks to fall precipitously. This chart shows net cash available to investors plotted beneath the DJIA. In December 2007, available net cash expanded to a new high, besting all extremes since at least 1992, a 15-year time span. Despite the presence of this mountain of cash, the DJIA lost more than half its entire value over the next 15 months. Indeed, as the chart shows, cash remained high right as the stock market entered the most intense part of the crash in 2008. Available cash does correlate with the market's moves, but the market is in charge, not the cash. --The Elliott Wave Financial Forecast, Jan. 29, 2010
(Stock Market Crashing Through With Cash, Market Myths Exposed)
�
In early February, EWI was ebullient as the market had corrected over the course of a three week period:
In case you were hiding out Tiger Woods' style far away from the mainstream media during the past month, let me be the first to say: January saw an abrupt end to the U.S. stock market's record-setting winning streak. Last count, the Dow Jones Industrial Average plummeted 4% in its worst monthly loss in a year.
And, according to one Feb. 1, 2010, MarketWatch story, "The time to consider an exit strategy" has officially arrived. Here, the article captures the public's astonishment turned acceptance of the Dow's boom-to-gloom shift:
"The Dow has shocked the bulls out of their complacency. After all, analysts were looking for the bull market to last until at least the second half of the year. Investors were not prepared for such a�sharp decline and now at least some of the chatter has gone from 'how high will the market go?' to 'how low will it fall?'".
Let me get this straight. The powers that be say it's time to "consider an exit strategy" -- AFTER the Dow has already plunged 700-plus points to land at its lowest level in two months. That's about as helpful as building a life raft AFTER your ship has begun to sink.
Then, those same sources go on to say investors were "not prepared" for the degree and depth of the stock market's decline. This is only partly true. On Main Street, the early January flood of bull-is-back-type headlines gushed in and washed all the bears away.
Yet, on our "Elliott wave" Street, preparation for a "sharp" decline in the Dow was fast in place. One week before the market turned down from its Jan. 19 high, Elliott Wave International's Short Term Update went on high bearish alert with this commanding insight:
"The Dow's diagonal remains intact and its form is clear. We will afford the pattern a bit of leeway over the next one-two days... but the structure is very late in development. That means a trend reversal is fast approaching. A potential topping range is 10,725-10,740. A close beneath [critical support] will confirm that the diagonal is over and the market has started a down phase that should draw prices significantly lower. Once a diagonal is complete, prices swiftly retrace to near its origin, which in this case is 10,263.90, the very first downside target." (Jan. 13 Short Term Update)
Soon after, the Dow peaked within four ticks of our cited upside target; next, it went on to fulfill the second part of its Elliott wave script with a staggering triple-digit slide to "near the origin" of the diagonal triangle pattern, and then some.
That leaves one question: Are the bears now ready to relinquish control of stocks? Don't wait for the market action to "shock" you. (U.S. Stocks: Will The Bears Relinquish Control?)
This pronouncement of a major top was released a few days after the bottom of what turned out to be a minor, garden variety abc correction. �For a few days, at least, EWI was in the money. �Here's the chart through that date:

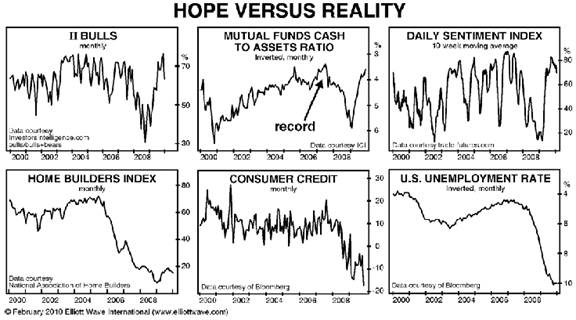
Later in February, EWI turned to a fundamental argument to buttress its predictions of an eventual stock market decline:
Bullish expectations (shown by the top three panels) may not be quite as extreme as they were in 2007, but adjusted for underlying economic conditions (bottom panels), the current psychology probably ranks right up there with the most complacent outlook in history. The charts of housing, consumer credit and unemployment show the systemically sluggish state of the economy. We know that fundamentals always lag psychological trends, but the lag is generally only a matter of months. It's been nearly 11 months since the outset of the Primary wave 2 rally; by these critical economic measures the rebound is barely registering.The wide disparity between the hope of investor expectations and the reality of economic strength shows that the great bear market -- already ten years old -- remains in its early stages. As the next leg down matures, hope will turn to despair, and it will become impossible to ignore the persistence of the economic contraction.
(What Chinese Malls Tell Us about the Economic Reality)
�
In April of 2010 EWI correctly pointed out a set of conditions which made a market top likely:
It is rare to have technical indicators all lined up on one side of the ledger. They were lined up this way -- on the bullish side -- in late February-early March of 2009. Today they are just as aligned but on the bearish side. Consider this short list:
- The latest report shows only 3.5% cash on average in mutual funds. This figure matches the all-time low, which occurred in July 2007, the month when the Dow Industrials-plus-Transports combination made its all-time high. But wait. The latest report pertains only through February. In March, the market rose virtually every day, so there is little doubt that the percentage of cash in mutual funds is now at an all-time low, lower than in 2000, lower than in 2007! We will know for sure when the next report comes out in early May. Regardless, the confidence that mutual fund managers and investors express today for a continuation of the uptrend rivals their optimism of 2000 and 2007, times of the two most extreme expressions of stock-market optimism ever.
- The 10-day moving average of the CBOE Equity Put/Call Ratio has fallen to 0.45, which means that the volume of trading in calls has been more than twice that in puts. So, investors are interested primarily in betting on further rising prices, not falling prices, and that's bearish. The current reading is less than half the level it was thirteen months ago and its lowest level since the all-time peak of stock market optimism from January 1999 to September 2000, the month that the NYSE Composite Index made its orthodox top. The 30-day average stands at 0.50, the lowest reading since October 2000. It took years of relentless rise following the 1987 crash for investors to get that bullish. This time, it's taken only 13 months.
- The VIX, a measure of volatility based on options premiums, has been sitting at its lowest level since May 2008, when wave (2) of ((1)) peaked out and led to a Dow loss of 50% over the next ten months. Low premiums indicate complacency among options writers. The quants who designed the trading systems that blew up in 2008 generally assumed that low volatility meant that the market was safe, so at such times they would advise hedge funds to raise their leverage multiples. But low volatility is actually the opposite, a warning that things are about to change. The fact that the options market gets things backward is a boon to speculators. Whenever options writers are selling options cheap, the market is likely to move in a big way. Combined with the readings on the Equity Put/Call Ratio, puts right now are a bargain.
- In October 2008 at the bottom of wave 3 of (3) of ((1)), the Investors Intelligence poll of advisors (which has categories of bullish, bearish and neutral), reported that more than half of advisors were bearish. In December 2009, it reported only 15.6% bears. This reading was the lowest percentage since April 1987, 23 years ago! As happens going into every market top, the ratio has moderated a bit, to 18.9% bears. In 1987, the market also rallied four months past the extreme in advisor sentiment. Then it crashed. The bull/bear ratio in October 2008 was 0.4. In the past five months, it has been as high as 3.4.
- The Daily Sentiment Index, a poll conducted by Trade-Futures.com, reports the percentage of traders who are bullish on the S&P. The reading has been registering highs in the 86-92% range ever since last September. Prior to recent months, the last time the DSI saw even a single day's reading at 90% was June 2007. At the March 2009 bottom, only 2% of traders were bullish, so today's readings make quite a contrast in a short period of time.
- The Dow's dividend yield is 2.5%. The only market tops of the past century at which this figure was lower are those of 2000 and 2007, when it was 1.4% and 2.1%, respectively. At the 1929 high, it was 2.9%.
- The price/earnings ratio, using four-quarter trailing real earnings, has improved tremendously, from 122 to 23. But 23 is in the area of the peak levels of P/E throughout the 20th century. Ratios of 6 or 7 occurred at major stock market bottoms during that time. P/E was infinite during the final quarter of 2008, when E was negative. We will see quite a few quarters of infinite P/E from 2010 to 2017.
- The Trading Index (TRIN) is a measure of how much volume it takes to move rising stocks vs. falling stocks on the NYSE. The 30-day moving average of daily closing TRIN readings has been sitting at 0.90, the lowest level since June 2007. This means that it has taken a lot of volume to make rising stocks go up vs. making falling stocks go down over the past 30-plus trading days. It means that buyers of rising stocks are expending more money to get the same result that sellers of declining stocks are getting. Usually long periods of low TRIN exhaust buying power.
I always feel obligated to say that indicators such as these do not necessarily pinpoint turns. From October 1998 through May 2008, technical indicators repeatedly reached extremes such as these and sometimes the market kept going up anyway, at least for awhile.
One of the most interesting things about the coming decline will be its initial slide down the Slope of Hope. The past ten years have seen an unprecedented sustaining of optimism in the face of deteriorating financial market and monetary conditions and a deteriorating economy. Even though the market is about to begin its greatest decline ever, the era of hope is not quite finished. (04/10 EWT; (Robert Prechter, What Do These 8 Technical Indicators Mean for the Stock Market?)
EWI has presented this same list of indicators at each juncture since August of 2009 (and continues to do so) as representing clear signals that the ultimate top is at hand. �I am going to reserve dissection of these data points for the next part in this series, but I will point out that while in part set of conditions has proven to be somewhat useful in identifying intermediate and short term declines within a bull trend, as Prechter himself points out above, but not largely applicable to identifying long term market turns. �I also called a top in April of 2010 based on a variety of technical indicators, including many of the same conditions included in EWI's reports, and the completion of a five wave pattern off the March 2010 bottom. �And for some time I did hold out the possibility that the bear market had returned. �I turned bullish in August following the July bottom and even more bullish at the September bottom.
Prechter presented the following commentary and chart to illustrate the anticipated topping zone for the Dow Jones:
As far as Elliott waves go, the rally since last March is totally normal. Two weeks off the low of March 2009, our Short Term Update published an upside target of Dow 10,000. So we knew a big rally was coming.
The August issue listed the range for typical retracement as being from 9368 to 11,620. This is a wide range, but there is nothing we can do about it; second waves have a lot of leeway. The illustration shown in that issue is reproduced below alongside an update of market prices. The Dow has so far stayed within the normal range."
Even so, I expected the rally to peak in the lower half of the target range then reverse. In August 2009, after 5 months, and in November, after 8 months, I was quite sure that the rally was ending. But instead of stopping near 10,000 at a 50% retracement, it has reached a 60% retracement. (Robert Prechter's Stock Market Trend Forecast 2010 to 2016)
Please note that the "range for typical retracement" somehow grew from Dow 9,000-10,000 in April of 2009 to�9368-11,620 in April 2010. �I'll also note that with the failure of the January decline to result in a major top, EWI shifted from labeling the rally as a simple ABC correction to a complex combination correction. �In this report, EWI also introduced the concept of a massive long term head and shoulders top in the Dow:

I'll briefly point out here that since the proposed right shoulder has now taken out the left shoulder high the probability that this formation will complete and succeed is significantly diminished.
Here's a picture of the market through that date:

EWI proceeded to call "The Top" of the presupposed Wave 2 correction with its next series of reports:
Fibonacci Time Relationships Suggest That the Biggest Stock Market Top Formation of All Time Is Ending in 2010 and That a Price Collapse Will Last Six Years, Until 2016.
Why a Historically Large Collapse Is Likely: Stock-market bulls and most economists think that a new bull market and economic recovery are underway. Most bears are looking for either a long sideways bear market a la 1966-1982 or a hyperinflationary run to infinity. Our Elliott wave outlook opposes both of these scenarios. The most likely profile is a stock market crash of historic proportions. There are a number of reasons why the Dow should decline into three digit territory...
Obviously, this outlook is extreme beyond all investors' present imagining. But consider how these socionomic expectations combine to indicate much lower prices: Downward adjustments in stock-market valuations by 60%, corporate worth by 80% and the dollar-based credit supply by 80%�all at the same time�would produce an overall stock-price decline of 98-99%. I consider a forecast of a 92% decline or more�i.e. calling for a triple-digit Dow�to be conservative.
One of the most interesting things about the coming decline will be its initial slide down the Slope of Hope. The past ten years have seen an unprecedented sustaining of optimism in the face of deteriorating financial market and monetary conditions and a deteriorating economy. Even though the market is about to begin its greatest decline ever, the era of hope is not quite finished.
Second waves rekindle optimism. Recall the environment after the peak of October 2007. The stock market slipped for a month and then rallied in Minor wave 2 into December; the consensus called for new highs...The decline that begins in 2010 will proceed along similar lines. But this time the entire decline will last four times as long as the 17 months of wave 1, so the entire process of dashed hopes will take longer. The fall will also be much deeper, so it will be impressive to watch how tenaciously investors, government and the Fed cling to hopes despite the market's continual falls to new lows. The era of hope will end when the last second wave is over and the last cycle has topped, just before the center of the declining structure. (05/10 EWT)
...the Dow does not yet sport five waves down at Intermediate degree. �So, the wave pattern has yet to confirm a new downtrend. But two things strongly suggest that a new wave of bear market is in force. First, volume continues to expand on declines and contract on rallies. Second, volatility has soared since the market's peak. These two conditions attend bear markets way more often than bull markets. We therefore maintain our opinion that the April 26 high was the end of the bear market rally that started in March 2009. (06/10 EWT)
As the market bottomed in July and rallied sharply, Prechter proclaimed the end for stocks once again:
The April 16, 2010 issue of The Elliott Wave Theorist, titled "A Deadly Bearish Big Picture," provided our roadmap for the next half dozen years in the stock market. Stocks are down from that point, yet as the companion issue of May 8 predicted, financial commentary has remained steadfastly bullish. The majority has hailed every rally since April as marking the resumption of a bull market. Following a gentlemanly article in the New York Times on July 4, my call for a serious resumption of the bear market is being dismissed and ridiculed in the press. �This is the way it should be because social mood, which regulates general stock market opinion, is once again historically elevated.
As for the short term outlook, the stock market rallies of June and July have the earmarks of a "wave 2", implying that a powerful "wave 3" down lies directly ahead. Even if it doesn't happen right away, it will occur eventually, so we are maintaining our stance of extreme safety and waiting for the market to issue its verdict. (07/10 EWT)
At this point three of EWI's top picks were in the green and two were underwater:

What Kind of Correction Is This?
Here's the introduction to the latest BullBear Weekend Report:
It's widely accepted that stocks are in a correction at this time. �The question remains: "what kind of a correction and how long and how deep will it go?". �My analysis has been and continues to be that we are in the initial stages of a bull market (in Elliott Wave terms SPX is currently in Wave 3 of a five wave bull run). �While this conclusion needs to be checked and reevaluated on an ongoing basis against market action, particularly during any corrective mode, at this juncture I see no evidence that indicates a major trend change in progress. �I'm approaching this decline as a pullback within an uptrend and will be working to identify a good entry point for a long position. �At the same time I will be working to identify a set of criteria that would cause me to cash out of profitable long positions and consider reversing to the short side.
Thus far, aside from the usual deflationist permabears like Robert Prechter, there has not been a big slew of calls for a major market top. �This is one indication that the correction still has some distance in time and price to travel before we see a bottom. �I would expect to see a good number of top calls in the blogs and a couple of days of "bears on parade" on CNBC and Bloomberg around the bottom. �In my estimation sentiment has yet to turn fully bullish with most traders and analysts only reluctantly and newly bullish but ready to turn bearish at the slightest provocation. �The public still remains almost entirely on the sidelines and out of the picture. � If this decline should fail to become a significant downtrend, then the reversal should be powerful and lead to a bit of a buying panic as shorts scramble to cover and sidelined long money tries to get a position. �The subsequent peak could lead to a more substantive correction.
Is it possible that we are in the beginning stages of a Wave 3 decline following a C wave high? �Yes, it is possible. �But I will be watching closely for the market to tell me what it is doing and what it will likely do going forward. �If it says "bear market" then I will be more than happy to follow its instructions and flip to the other side.
HERE�is a prime example of how few real bulls there actually are. �One hiccup and he is running for the exits with wild imaginings of some impending doom around the corner. �My sense is his line of rationalization is representative of a larger psychology at work.
The Egypt situation acted as the catalyst for this correction and I would call that a bullish factor. �Corrections that are sparked by event fears are generally reversed sharply. �They can be sharp and scary but short. �There really isn't any resolution to Egypt's troubles that can change the underlying bull trend in US stocks. �It can in the short term chase some of the fast money and bullish sentiment out and thereby prepare the stage for the next leg higher. �If an Islamic Fundamentalist group should seize power and spark a war with Israel, it may occasion a deeper and longer correction but it wouldn't change anything about the bullish underlying market dynamics.
Right now, capital is steadily flowing from safe havens to risk. �This is a process that is in its early stages and is largely unrecognized. �Most market participants are still framing the current market dynamic as a tug of war between inflation and deflation. �This is what drives the Wave 3 move. �When the point of recognition is met, the flood of capital will propel markets much higher.
Last week I commented that the best trade setup on the radar was short gold, and that was borne out by market action. �If you traded that with me you are now well into a profitable position. �Gold permabulls�can't even bring themselves to contemplate the possibility that the bull market is over and are treating this bearish move as a buying opportunity. �This is the type of psychology which prevails at the end of a trend. �In my estimation gold has traded as a risk hedge for some time now and its decline is part of the unwinding of the fear trade. �It's possible that the next leg down in gold will correlate with a broadening recognition that the primary market dynamic has shifted to an unwinding of safety trades and a move into risk plays.
�
�
Need some help staying on the right side of the markets? �Join the�BullBear Trading�room at�TheBullBear.com. �You'll get this kind of timely, incisive, unbiased analysis daily. �It's free to join, no credit card is required and if you like my work you just make a donation at the end of each month.

http://tinyurl.com/4oys5jj
BullBear Market Report (January 2011)
�
Here's my recent analysis originally published for BullBear Traders members on 1/15/11 and updated through 1/26/11:
�
SUMMARY
Thusfar markets have proceeded pretty much as my analysis had anticipated. �US equities are now fairly well confirmed to be in a major Wave 3 advance. �Increasingly, signals are indicating that the 10 year long lateral bear market is over. �The primary fundamental is the secular reallocation of capital from safety of bonds (and the risk of the public sector) to equities. �Other safe haven assets, such as gold and the Japanese Yen, appear ready to go into bear markets. �Notwithstanding the "sentiment surveys", market psychology is only just now turning somewhat bullish as the majority of participants gradually wake up to the unfolding bull market. �The public remains entirely on the sidelines waiting for "the crash". �The current wave could see a bit of an acceleration next week as earnings results confirm that corporations are doing well, providing investors with the excuse needed to take the plunge into stocks. �While we cannot entirely discount the bearish scenario, it is becoming stretched to nearly the breaking point. �As BullBears, we'll need to keep one eye on the mouth of the cave to see if he is stirring in his lair, but chances are pretty good the bear is in hibernation and will be for some time.
The US Dollar and the Euro continue an ongoing �epic battle royale. �I'm not betting on either at this time, but I am leaning in the direction the world reserve currency. �In addition to a good technical and contrarian case, the dollar will also be in big demand as the economic build out of 2/3 of the planet proceeds over the next decade.
Commodities look set for a C wave correction as the dollar strengthens. �I am not anticipating a bear market in commodities, but it is possible that as a group the best days are in the rear view mirror. �Individually, there is quite a range of possibilities. �Select commodities may continue in bull mode in all time frames while others go into bear mode.
Safe haven markets appear to be entering bear markets. �This includes bonds, precious metals and precious metals stocks. �The bond bear market is well along but the gold bear market is as yet unconfirmed. �There is yet hope for the gold bull, but it's fading. �There are many reasons to think that a major top is in place for gold. �I'll be detailing that in a forthcoming special report. �In the meantime I am short from 1368.
�
S&P 500
SPX is our benchmark for US and world equity direction. �It's our weathervane. �And right now it is telling us that springtime has come for stocks. �I am long multiple SPX buys off the September bottom with the last coming this week at SPX 1268.
Here's the preferred wave count:
 This puts it in an ultra bullish iii of iii of (3) mode. �Note the long term bull cross of the 50 EMA over the 200 EMA. �It's a major technical event that has been entirely ignored. �Such a cross often acts as a flash point, particularly in the context of such a very bullish setup. �Even so, many pundits continue to try to call intermediate and long term tops here.
Here's a shorter term view:
 Several Fibonacci projections cluster in the 1340 area. �That may be a level we can look at for a short to intermediate term top. �It may be potentially a place to take some profits or just buy the dip to add to the position. �In either case it should be a resistance zone.
Another short term view has a short term top potentially in place.
 A close below 1280 might mean a correction is underway.
A much longer term view shows a potential roadmap going forward.
 There is an intense cluster of Fibonacci targets in the 1315-1350 area which also corresponds with the August 2008 high and lateral price resistance from 2007, making this a likely short to intermediate term topping area. �The full wave 3 has targets at the 2007 highs.
The bearish scenario is still somewhat plausible. �Let's have a look.
 The 78.6% Fibonacci retracement of the fall from the 2007 top could make a good C wave high to complete the ABC corrective Wave 2. �I'm not leaning that way because too many other factors argue for the bull scenario. �
�
Analysis
Other indices have eclipsed their 2007 highs and more are close to doing so.
Nasdaq 100 has obliterated its 2007 high and has not looked back.

�
Midcaps closed this week above the 2007 high.

�
Small caps are not far behind.

�
The Nasdaq Composite is just a few days away.

�
Consumer goods and transports are knocking on the door.

![]()
�
Big cap corporate equities worldwide experienced breakouts from reverse head and shoulders patterns. �Here's the World Leaders Index:
 The big cap European stocks of EuroStoxx 50 Index are showing the same very bullish pattern breakout:

Big moves are pending in both those indices. �These are not markets that are topping but rather breaking out.
During Wave 3, investors reallocate into the new bull market away from old bull trends. �In this case there is a massive, secular shift from bonds to equities underway. �I spotted this some time ago using a variety of SPX to Bond ratio charts. �Here's the long term monthly to US 30 Year Treasury ratio:
 After a 3 wave ABC corrective, it is showing clear signs of entering an impulsive 3rd wave up. �This is probably the most important chart in the financial world right now (I've been saying that for a long time now) and yet it is still almost completely off the map. �Bill Gross, the Bond King, announced some 9 months ago that PIMCO was getting out of bonds and opening up equity funds, stating plainly that bonds had topped. �Even so, until very recently very few have taken heed.
BullBear Trader Phillipe writes:
Hi Steven,
I've been keeping an eye on the SPY:TLT ratio since you brought it up as a measure of the risk appetite. Right now I'm seeing a divergence in this ratio with the MACD making lower highs while the ratio is making higher highs since mid-November. Could this be a warning of an impending correction in the markets despite the wave 3?
I hope you will be touching on this during the weekend update. Thanks for all your hard work.
Philippe
�Here's a chart to illustrate Phillipe's point:

Clearly there's the possibility of a pullback in this ratio. �The divergence may be a signal. �But does it mean that stocks could sell off or that bonds are due for a bounce? �Phillipe is looking for a possible pullback in a Wave 3 environment. �As I have been saying since September, pullbacks in this context are buying opportunities. �Most of the investing public is only just now waking up to the opportunity in stocks and the risk in bonds. �It is going to take some time for that process to unfold. �Unless there is a clear fifth wave top and unless such a signal is confirmed by multiple similar divergences in other indicators, we can't really give it much weight. �Divergences can persist for some time during bull runs and don't mean much. �They can, however, be a "Wall of Worry" item for technical traders. �It's important to stay focused on the big picture and the big trend and not look for reasons to get nervous or worried. �This is still a relatively young bull market. �In the bigger scheme of things, it's even possible we are now only in 1 of a larger scale 5.
A lot of attention has been given to such divergences of late. Bears are clinging to their view largely based on such technicals. �First, it's important to reiterate that it is quite common for indicators to show divergences or overbought conditions for protracted periods of time during a Wave 3. �In addition, much of the data involved is drawn from all issues traded on the NYSE. �A very large percentage of those issues are non-equity, fixed income�bond funds. �Since bonds have been getting killed lately, indicators based on this data have been significantly skewed creating apparent divergences. �When we look at commonly used indicators calculated from NYSE Common Stock Only (CSO) data the picture can be quite different. �Let's look at the 200 EMA of Advances-Declines:
�


The lower charts, using CSO data, shows the indicator making higher highs with the index. �The upper chart, using all NYSE data, is showing divergences. �While it is true that there is still a divergence on the CSO chart from the April high, this indicator can be viewed more as an overbought/oversold indicator, which means that it is not yet as overbought as it was in April and there is still potential upside.
A look of the Wilshire 5000 Total Market Index to Dow 30 Industrials ratio chart is also shows broad market participation.
 There's nothing here that confirms the potential weak breadth that certain NYSE based indicators are showing. �Note that divergences in the ratio have been present at major market turing points during the bear market. �In fact significant resistance is being penetrated and there appears to be a reverse head and shoulders formation in the chart. �The SPX to Dow ratio chart is also breaking out very bullishly:

In further support of the theme of a secular shift to Risk from Safety that I began to write about over a year ago, here's an SPX to Gold ratio chart:
 Since March of 2009, stocks have outperformed gold and the ratio has recently broken out of a bottoming formation. �As long as the driving fundamental is inflation (vs. deflation) then both should rise together and gold should outperform. �This chart seems to be saying that the true underlying fundamental is a drive towards risk investment and growth. �While monetary inflation, risk, and growth can certainly coincide, they may not. �Inflationists tend to focus only on the supply side--large scale "money printing" by Central Banks--and ignore the demand side. �If, indeed, the world is entering a lengthy period of exceptional economic expansion as 2/3 of the planet is built out, then demand for the world reserve currency in the conduct of international trade and investment may outstrip supply, sending the US Dollar into a bull market.
The chart of the USD Index is showing an intense oscillation in the area above and below key long term support/resistance at the 80 level:

I've charted a very long term head and shoulders top formation (red) and a long term reverse head and shoulders bottom (blue) formation. �There's also a triangle (blue) of converging lower highs and higher lows. �This market is showing an intensifying oscillation above and below long term support/resistance at the 80 level. �Eventually it will break decisively in one direction or the other. �A look at a shorter term chart indicates that this may come sooner rather than later.
 The wider oscillation has narrowed since November to a band above 79 and 81 in the direct vicinity of its 20, 50 and 200 day EMAs. �It is also the direct vicinity of its weekly and monthly moving averages as well. �This kind of "moving average convention" on all time scales is forecasting a major move soon. �Recent action would tend to suggest a downward break since price is not below all the moving averages and at the lower end of the consolidation range.
The fate of the Dollar Index should bear heavily upon the future of commodities and gold. �CCI Commodities Index appears to have completed a five wave move and may be in the middle of a correction.
 The recent move up may have been a b wave with c to follow soon. �The RSI divergences tend to support this. �If USD does break out, dollar sensitive trades should correct. �Equities will probably largely ignore it.
�
01/19/11 UPDATE:
�
So we have some selling today and it could be the beginning of some kind of correction. �A close below 1284 would put me on correction alert.
The first scenario is that SPX has completed a wave i of iii top. �1264 or 1248 are good targets for the wave ii bottom.

�
The second possibility is a completed top off the July 2010 bottom. �This would be the most bearish of the prospective corrective scenarios. �I would guess we will see a slew of long term top calls off of today's corrective action. �If this is a complete 5 wave pattern from July a good target would be a retest of the April high near 1220.

�
A third possibility is that a very minor wave iii top is in place. � The last correction was a zigzag so this would likely be a shallow flat.

�
We are also seeing some significant weakness in the dollar across the board and a potentially key breakout in Euro. �DollarYen is now out of our range and we need to close that trade and wait for another opportunity. �Commodities are also weak and selling. �Gold is hovering above support but if it fails a big selloff should ensue. �Short gold, if 1259 does fail, may be the best fresh trade setup out there right now. �If it gets back above 1387-1392 then the correction/bear market has aborted and shorts need to be closed out.
�
�
01/24/10 UPDATE:
�
SPX appears to be in corrective mode and currently in a B wave up. �Here's the futures chart (note that there is an approximately 4 point difference between cash and futures market):
�
 B could eclipse the recent high of fall a little short. �In either case a C wave down is very likely. �Although it will likely be a minor correction, it should bring out the top pickers and the crash callers and help to reduce a bit of the bullish sentiment in the market. �It would probably be a big buying opportunity since it would set the basis for a iii of 3 of (3) wave up. �Bulls would not want to see that second blue uptrend violated, however. �At that point we would have to get a little cautious and reevaluate the situation.
The Nasdaq 100 to Dow ratio is confirming the corrective condition of the market.
 When NDX surrenders its leadership position in a bull phase, it generally indicates a corrective mode is in place.
It could take another 10 days to two weeks for the C wave to bottom out. �Traders should marshal their capital for what may be one of the very rare long entry points this year. �And I will say we will be lucky to get this C wave down; it may not even happen. �While many analysts and traders are still worrying about a crash or bear market, the real worry is whether the market will give any decent entry points at all.
If you are in, don't try to get fancy and trade in and out. �You will lose your position and regret it. �If you have yet to establish your position, the coming (hopefully) C wave down will be your best bet to get a decent entry.
Good luck and good trading!
�
�
Need some help staying on the right side of the markets? �Join the�BullBear Trading�room at�TheBullBear.com. �You'll get this kind of timely, incisive, unbiased analysis daily. �It's free to join, no credit card is required and if you like my work you just make a donation at the end of each month.
�
�
http://tinyurl.com/4kkmbwn